How to find queries while tracing in SQL Server#
Let’s say you’re working on a DEV database and you’re trying to get some information from SQL Server Profiler about the number of READS or WRITES that your queries are making and / or CPU time spent or other metrics. On a database with a lot of users running queries on the DB at the same time this can be difficult. But luckily there’s an easy fix to find those queries.
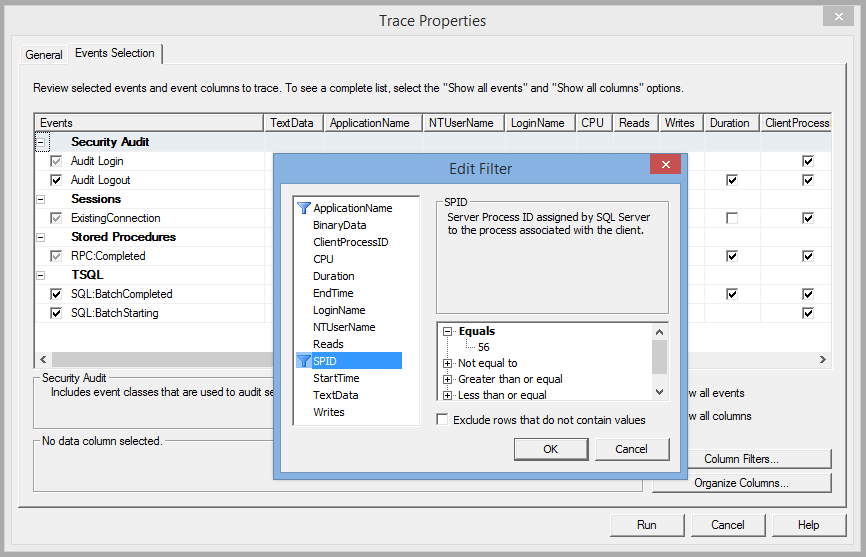
So, if you’re running queries from SSMS and want to identify your queries much easier in SQL Server Profiler you can filter the trace by Server Process ID (SPID). Now, in order to get this value let’s remember that each tab in SSMS has its own session / process communicating with the DB, so each tab will have a different Server Process ID.
So, to find out the corresponding SPID for a specific query tab all you need to do is:
SELECT @@SPID
Be mindful though, that this is available only for SQL Server 2008 and up.
I hope this saves you a lot of time, it certainly did it for me, whenever I had to use SQL Server Profiler on a busy database.